Explore large datasets with Champions’ Clustering Heatmap.
Our Clustering Heatmap is a web-based tool which aims to visualize and analyze high-dimensional data as interactive and shareable hierarchically clustered heatmaps. Build heatmaps using Champions multiomic PDX dataset or customize gene expression heatmaps using public datasets, Champions cell lines or your own in-house datasets.

Clustergrammer Inputs
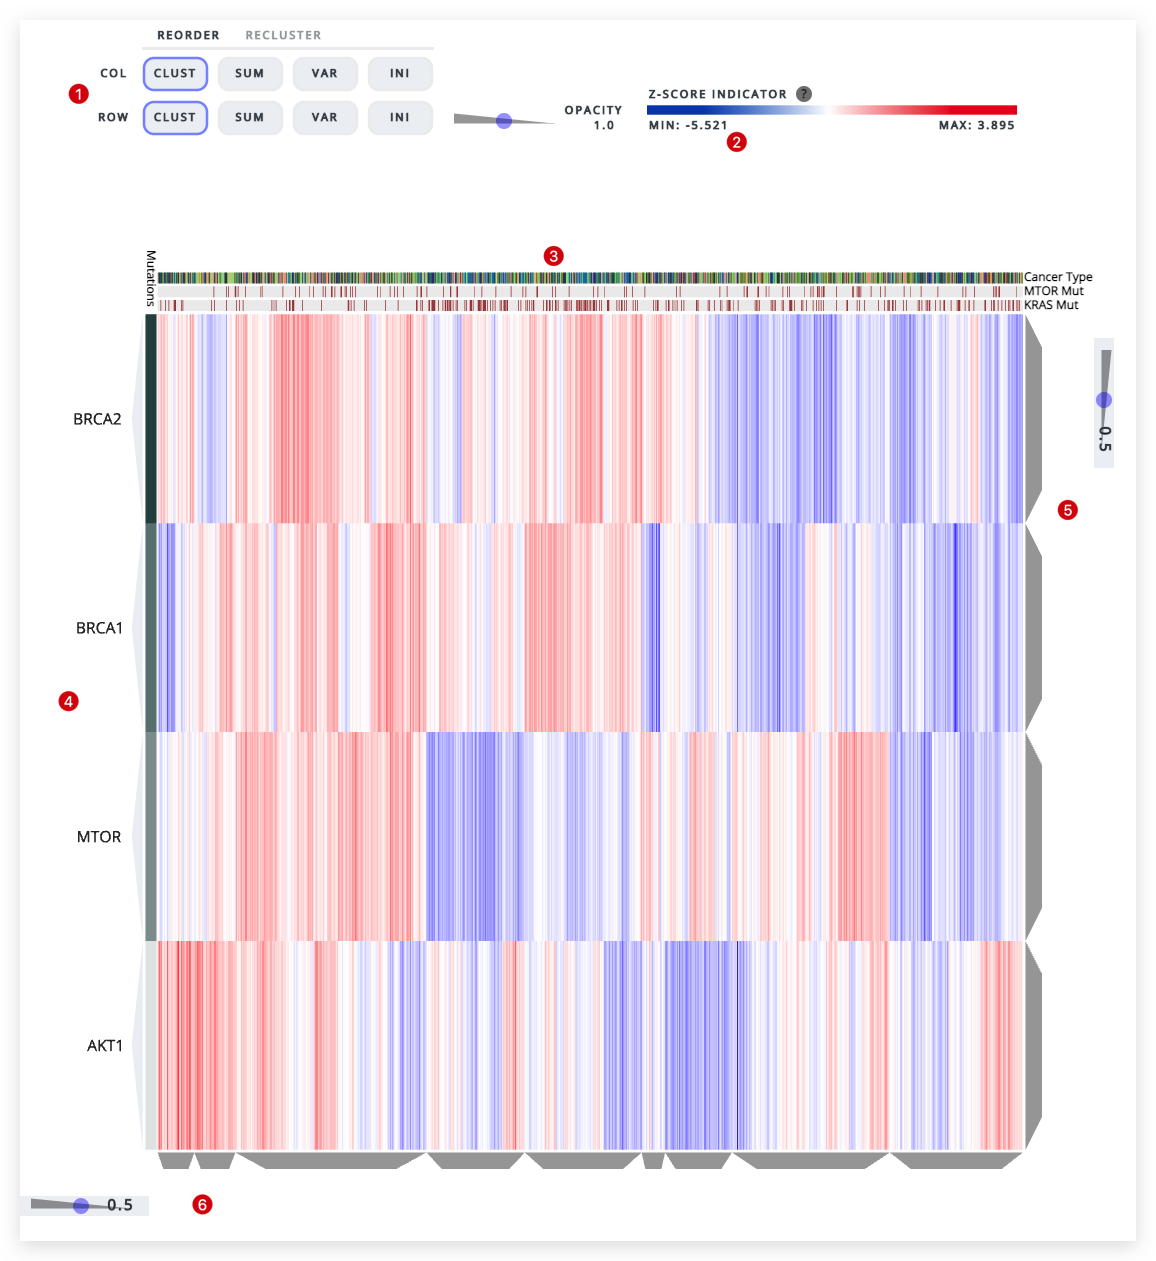
Heatmap for genes BRCA1, BRCA2, AKT1, MTOR with gene mutations for MTOR and KRAS in the Champions PDX dataset with all cancer types, models and agents visualized.

Clustergrammer Visualization

Clustergrammer Table
View all the models within the heatmap as a table for each gene of interest, z-score and TPM value. This table can be exported as a CSV or an Excel File by clicking the button at the top left of the table (highlighted in red).
Champions PDX RNASeq
Champions PDX Proteomics
Champions PDX Phosphoproteomics
Champions PDX Kinase
Champions Cell Lines
TCGA
GEO
CPTAC
Your Data
Clustering
Clustering is the process of grouping the data into clusters or classes, so that objects within a cluster have high similarity in comparison to one another but are dissimilar to objects in other clusters.
TPM
Transcripts Per Million (TPM) is a normalization method for RNA-seq. You can interpret this as “for every 1,000,000 RNA molecules in the RNA-Seq sample, x came from this gene/transcript.”
Z-Score
Z-Scores are calculated by subtracting the overall average gene abundance from the raw expression for each gene, and dividing that result by the standard deviation (SD) of all of the measured counts across all samples or across the selected criteria depending on which you choose.
TGI
Tumor Growth Inhibition (TGI) rate is a common metric used to quantify agent response of treatments compared to the control. It is calculated using the formula (1 – (mean volume of treated tumors)/(mean volume of control tumors)) × 100%.
Coming Soon!!
Clustergrammer is based on the work of Fernandez et al: Fernandez, N. F. et al. Clustergrammer, a web-based heatmap visualization and analysis tool for high-dimensional biological data. Sci. Data 4:170151 doi: 10.1038/sdata.2017.151 (2017).