Explore datasets with unsupervised machine learning.
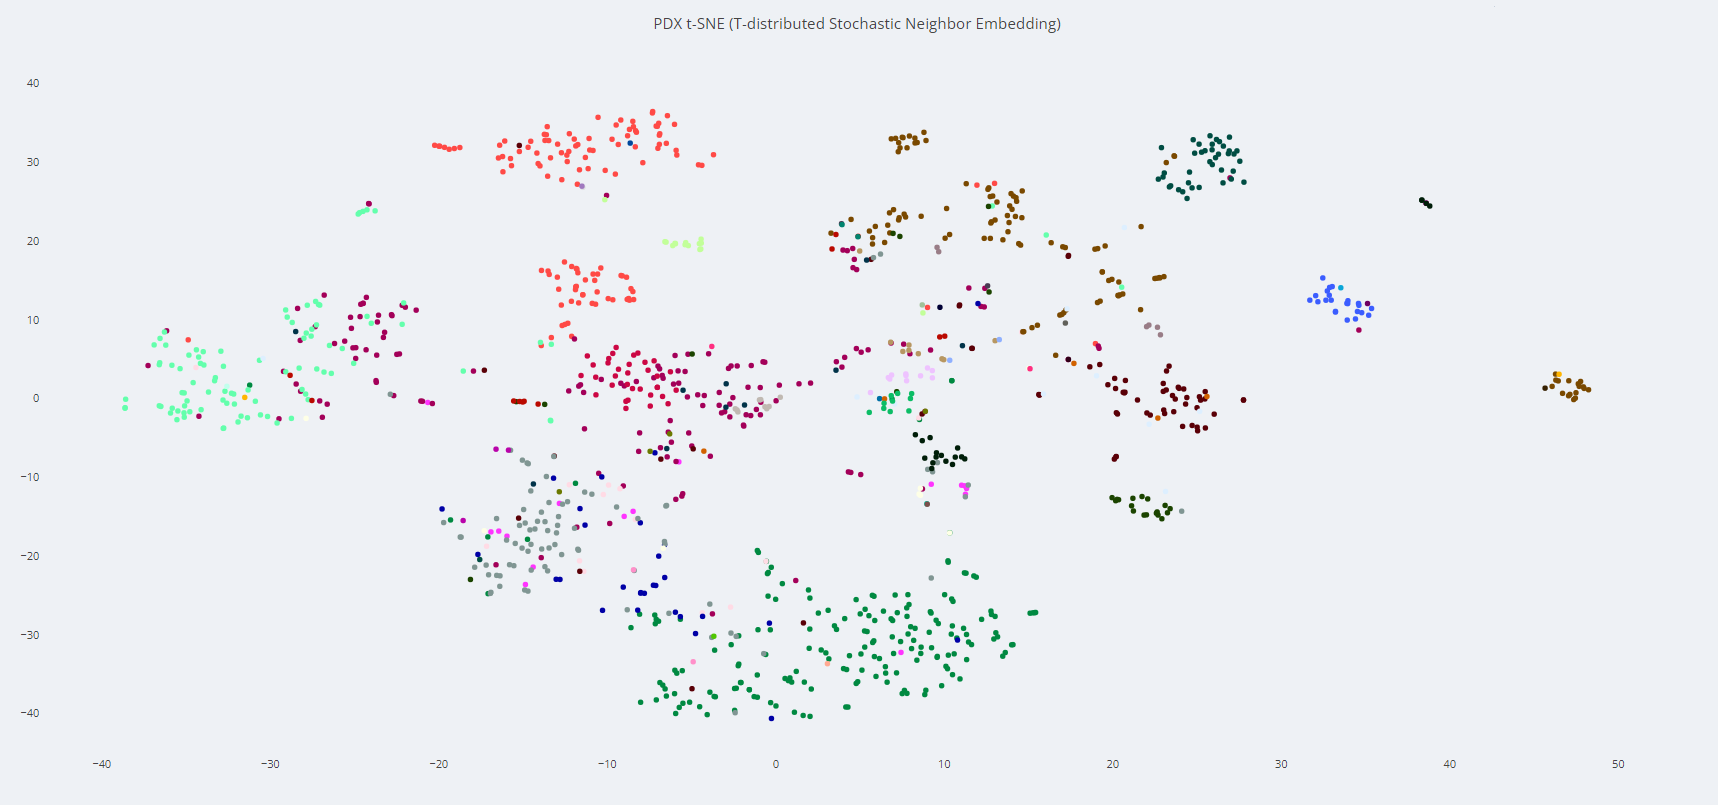
Our Global Clustering tool aims to help users vizualize Champions PDX models in a T-SNE and overlay gene expression or agent response data. Your in-house RNASeq data can be uploaded and aligned in a T-SNE or overlaid in a UMAP with TCGA or Champions PDX model data.
##Global Clustering Input

Global Clustering Inputs

Global Clustering Visualization
This plot shows the similarity between the Champions PDX samples for visual analytics, where the similarity for each point is visualized as proximity of the points. Sample points that are ‘similar’ are placed close to each other.
Champions PDX
Champions Cell Lines
TCGA
Coming Soon!
Plots produced by Plotly. The front end for ML and data science models. Plotly. (n.d.). Retrieved 2022, from https://plotly.com/