Explore Molecular Data
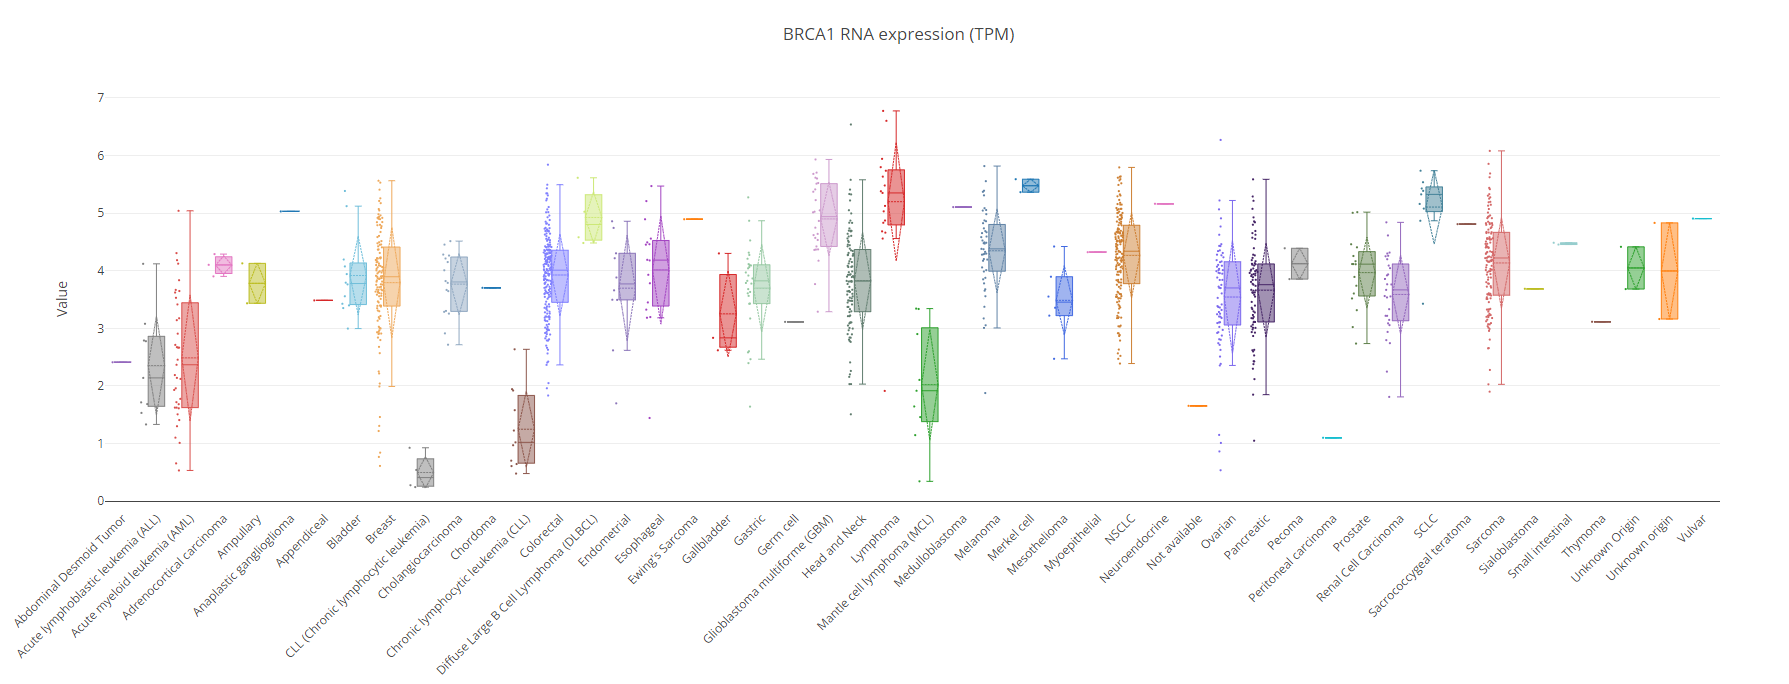
Our Molecular Graphing Tool aims to plot expression across samples by cancer type.

Molecular Graphing Input

Molecular Graphing Visualization
Champions PDX RNASeq
Champions PDX Proteomics
Champions Cell Lines
TPM - Transcripts Per Million (TPM) is a normalization method for RNA-seq. You can interpret this as “for every 1,000,000 RNA molecules in the RNA-Seq sample, x came from this gene/transcript.”
Z-Score - Z-Scores are calculated by subtracting the overall average gene abundance from the raw expression for each gene, and dividing that result by the standard deviation (SD) of all of the measured counts across all samples.
Coming Soon!
Plots produced by Plotly. The front end for ML and data science models. Plotly. (n.d.). Retrieved 2022, from https://plotly.com/