Explore descriptions of each of the datasets Champions has to offer
Champions offers Champions’ derived data (PDX), public data (TCGA, CPTAC, GEO, Achilles), and the opportunities to upload your own data for use across all of our visualizations.
An overview of which dataset can be visualized where is available in the table below:
| PDX | Cell Lines | TCGA | GEO | CPTAC | Achilles | Your Data |
|---|---|---|---|---|---|---|
| Gene Networks | Yes | Yes | No | No | Yes | No |
| Molecular Signatures | Yes | No | Yes | No | Yes | Yes |
| Clustering (t-SNE) | Yes | Yes | Yes | No | No | No |
| Molecular Graphing | Yes | Yes | No | No | No | No |
| Clustergrammer | Yes | Yes | Yes | Yes | Yes | No |
| Mutation Mapper | Yes | Yes | No | No | No | No |
| Oncoprint | Yes | Yes | No | No | No | No |
| DGE (Group A vs B) | Yes | Yes | No | No | No | No |
| High/Low Expression | Yes | Yes | No | No | No | No |
The Champions PDX bank was derived from human patient tumors prior to (treatment-naïve) or after undergoing standard-of-care therapy (post-therapy). It is a collection of 1000+ low-passage PDXs (patient-derived xenograft) derived from human tumor samples.
As part of our internal research and development, we performed over 3,400 in-vivo PDX efficacy studies and obtained response rates of our PDX models to a number standard of care therapies. Molecular data (whole-exome and RNA sequencing) from these PDXs was obtained after passaging (2-3 passages) in mice. This gene signature was calculated based on the differential expression of the user specified gene in PDXs obtained from post-therapy vs. treatment-naïve patient tumors. Thus, this signature reflects the gene expression landscape of the indicated tumors after undergoing standard-of-care therapy with the indicated drugs. The individual values are sign-corrected log10 p-values of gene expression differences. E.g. a value of -2, (representing a p-value of 0.01), for gene “A” indicates that the expression of gene “A” is reduced in patient cancer samples after receiving the standard-of-care therapies described relative to treatment-naïve samples. Conversely, a value of 2, (representing a p-value of 0.01), indicates increased expression of gene “A” in patient cancer samples after receiving the standard-of-care therapies described relative to treatment-naïve samples.
Many of these are the same models available to clients to commission their own studies.
PDX update! In addition to PDX RNASeq, Champions now offers PDX proteomics, PDX phosphoproteomics, and PDX Kinase for the Clustergrammer and Networks visualizations.
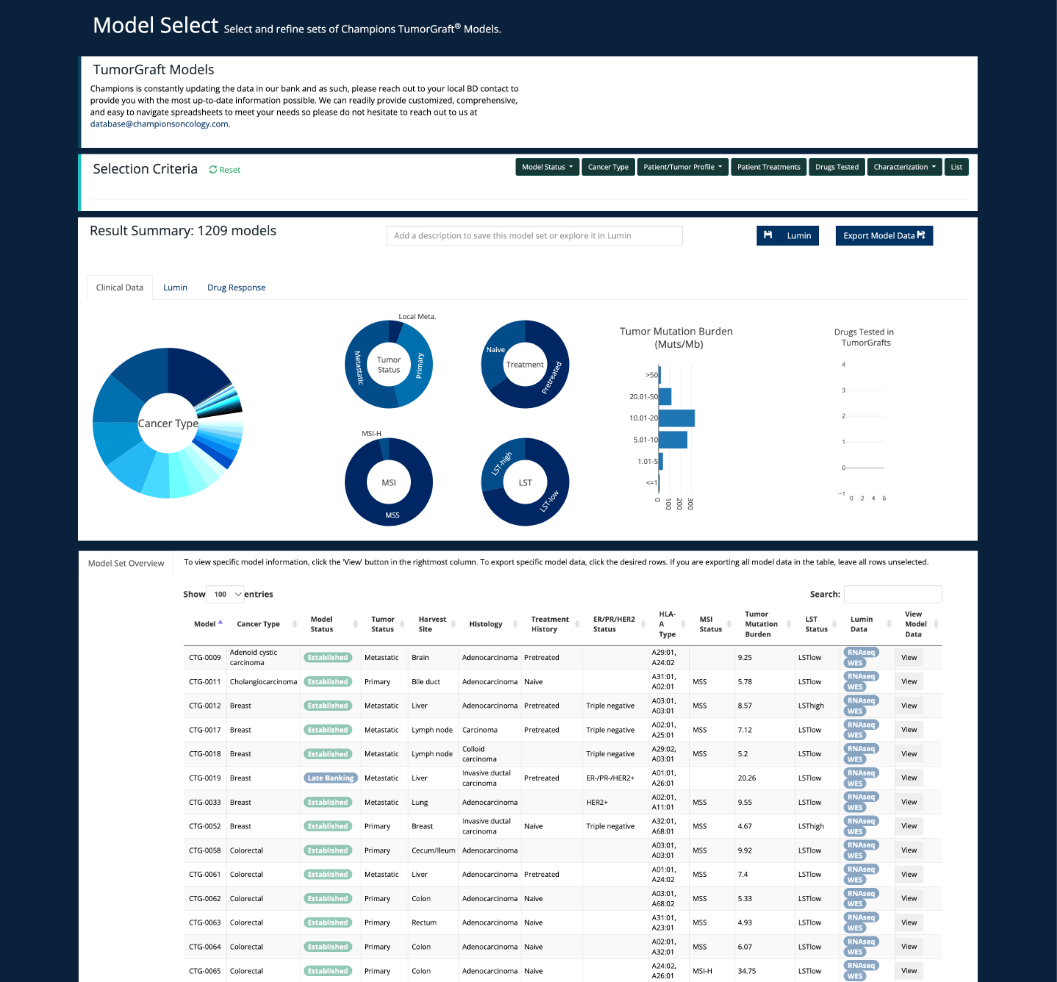
View the status of sequencing and proteomics in ever updating bank of PDX models on our Model Select Page. The guide for using this can be found under ‘Lumin Tools’.

Model Select
Please find more information on this under ‘Lumin Tools - Model Select’.
Champions now offers Cell Line Data for multiple visualizations.
Find documentation on using the Cell Line Select page under ‘Lumin Tools’ or follow the link below.
Public dataset harnessed by Champions.
The Cancer Genome Atlas (TCGA), is a publicly available landmark cancer genomics program, molecularly characterized over 20,000 primary cancer and matched normal samples spanning 33 cancer types. This joint effort between NCI and the National Human Genome Research Institute began in 2006, bringing together researchers from diverse disciplines and multiple institutions.
Over the next dozen years, TCGA generated over 2.5 petabytes of genomic, epigenomic, transcriptomic, and proteomic data.
Public dataset harnessed by Champions.
The Gene Expression Omnibus (GEO) is an international public repository that archives and freely distributes microarray, next-generation sequencing, and other forms of high-throughput functional genomics data submitted by the research community.
The National Cancer Institute’s Clinical Proteomic Tumor Analysis Consortium (CPTAC) is a national effort to accelerate the understanding of the molecular basis of cancer through the application of large-scale proteome and genome analysis, or proteo-genomics.
The CPTAC seeks to perform deep-scale proteogenomics profiling across multiple cancer types, including breast invasive carcinoma, lung adenocarcinoma, ovarian serous cystadenocarcinoma and others.
Proteogenomics is an approach to tumor profiling that combines next-generation DNA and RNA sequencing with mass spectrometry-based proteomics to provide deep, unbiased quantification of proteins and post-translational modifications such as phosphorylation.
The project “Achilles” led by Broad Institute aims to delineate the map of genetic dependencies in cancer cell lines. The current dataset comprises genetic dependency values for 18,000+ genes across 739 cancer cell lines.
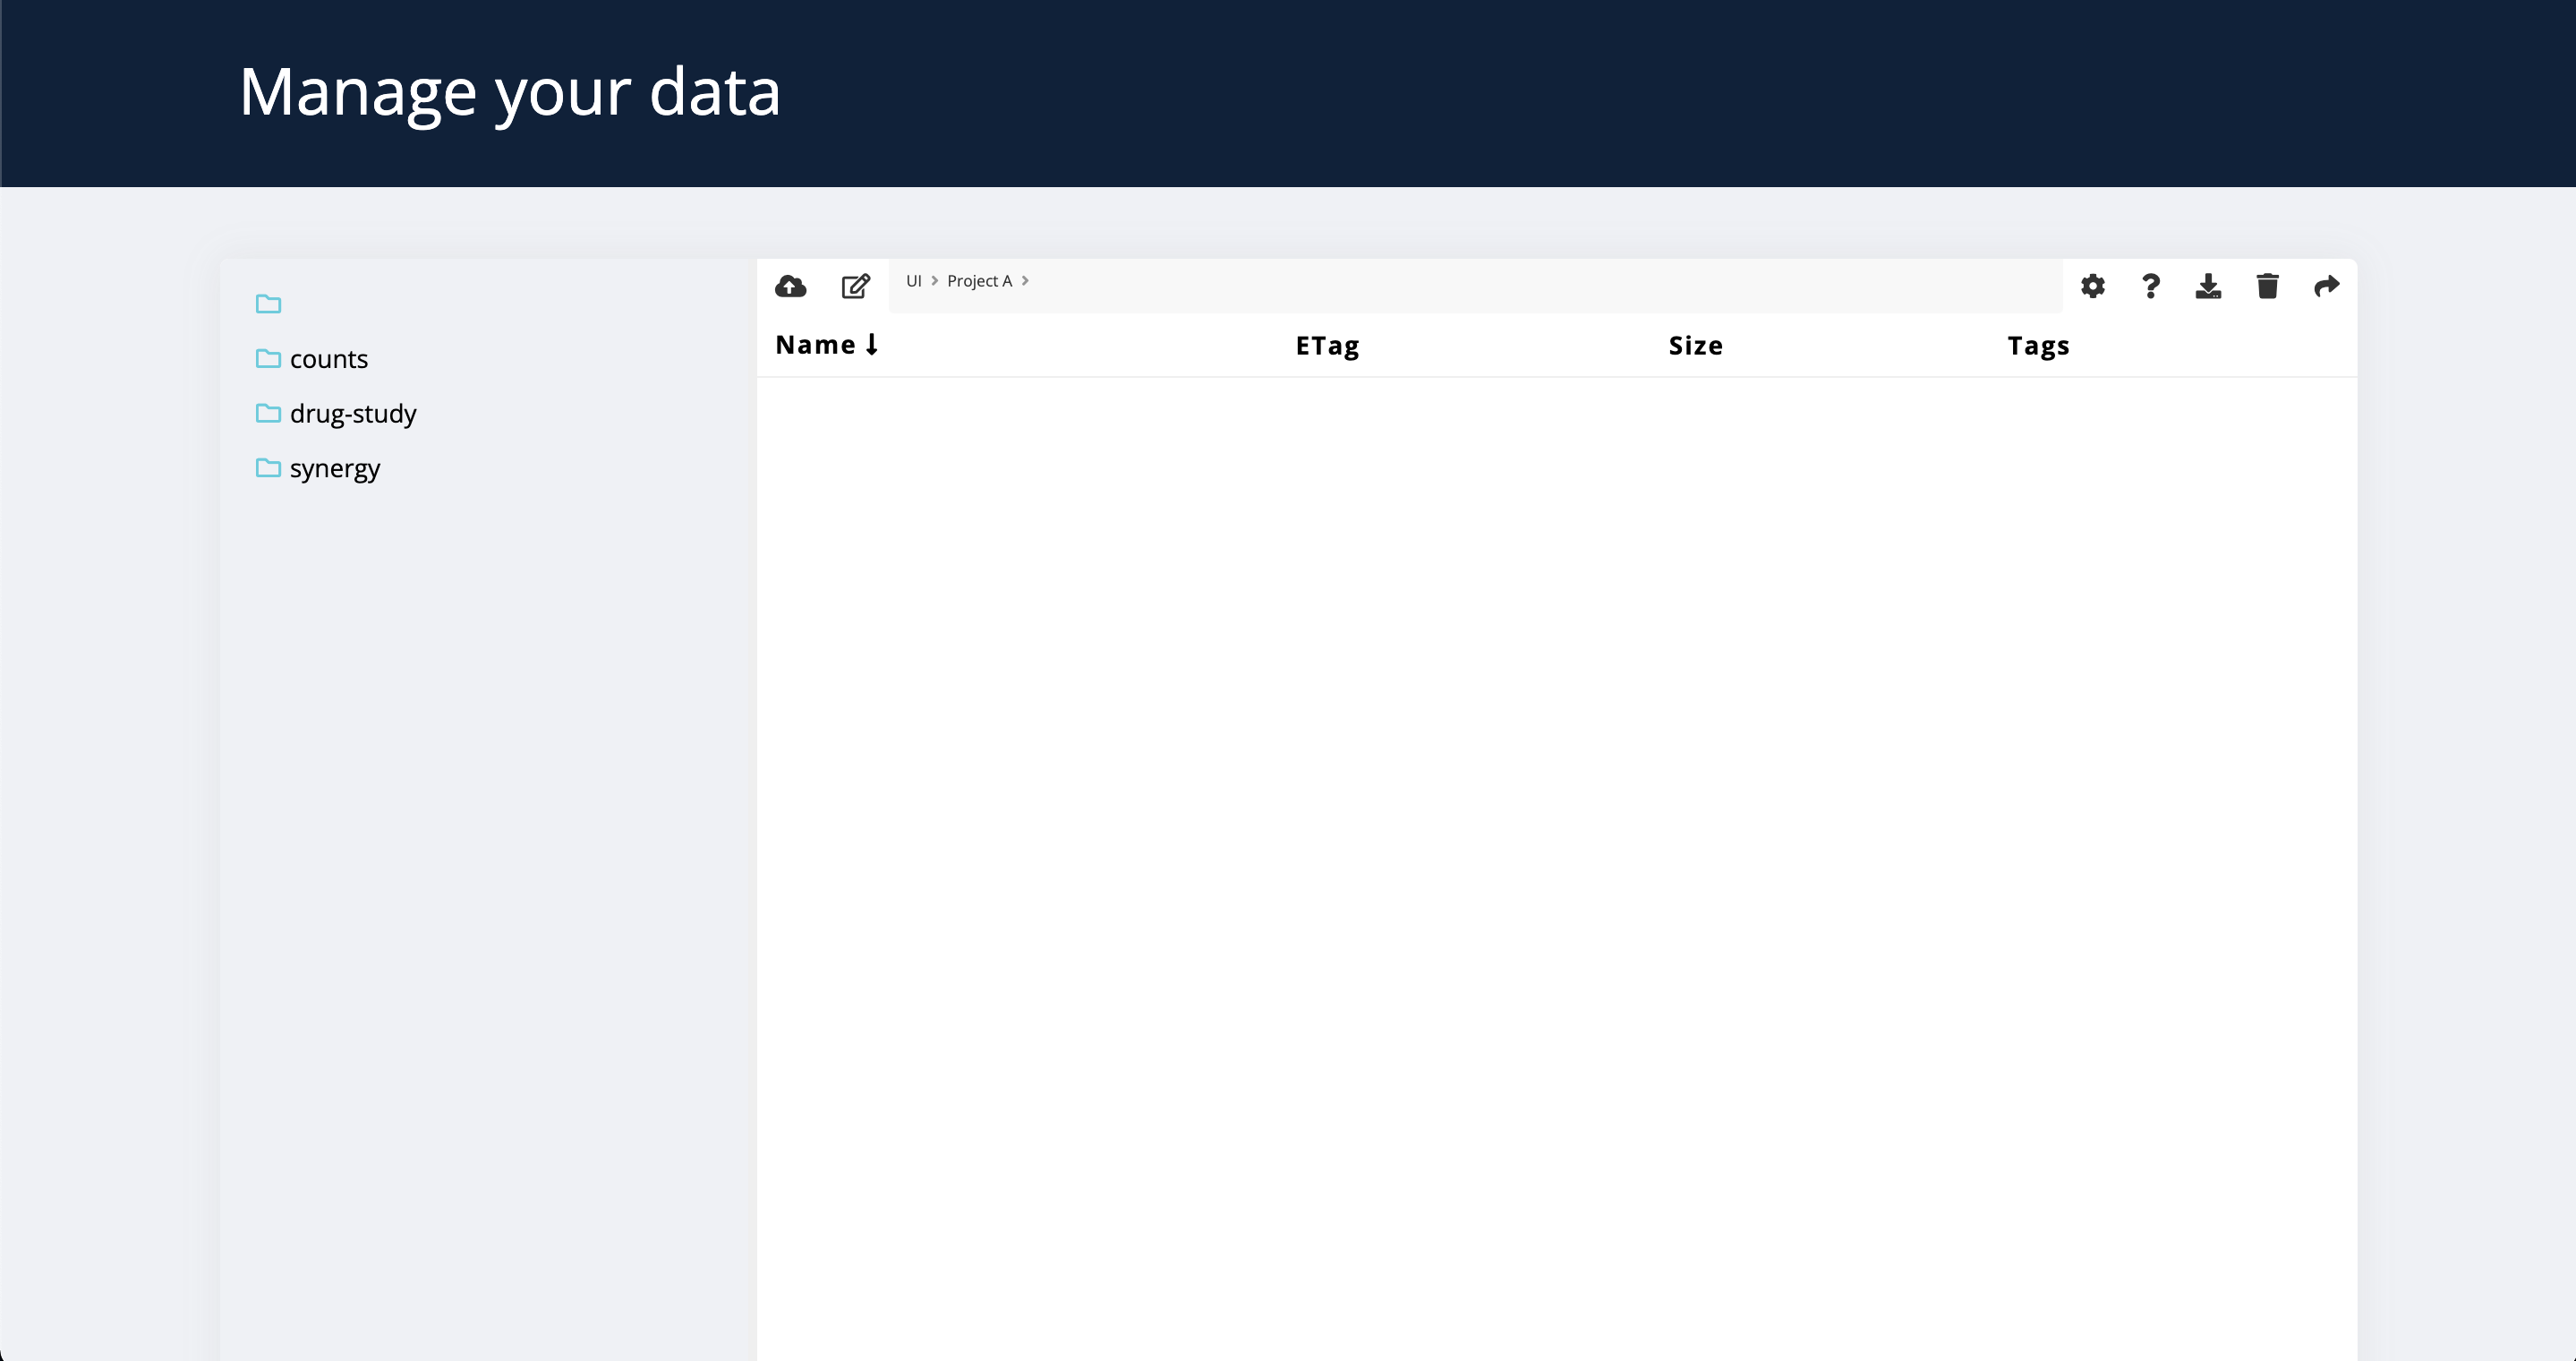
Champions offers users the opportunity to upload their own data for use across multiple Lumin visualizations. Use the Uploads page to add files and view your data here. If you have commissioned RNA sequencing on either your own samples or for a post-study Champions PDX model you do not need to upload your data, it will be available in Lumin as soon as it is ready.

Uploading Your Data