General Description
Our network visualization aims to map interactions between genes of interest and other genes available within our Champions derived data, public datasets, and your uploaded data. It allows users to build protein-protein interaction maps which leverage data from the Pathway Commons database. Interactome maps can be overlaid with gene expression, protein expression or kinase activity for Champions PDX models. This tool also visualizes phospho-proteomic data from Champions’ PDX models or the public CPTAC database.
Network Visualization
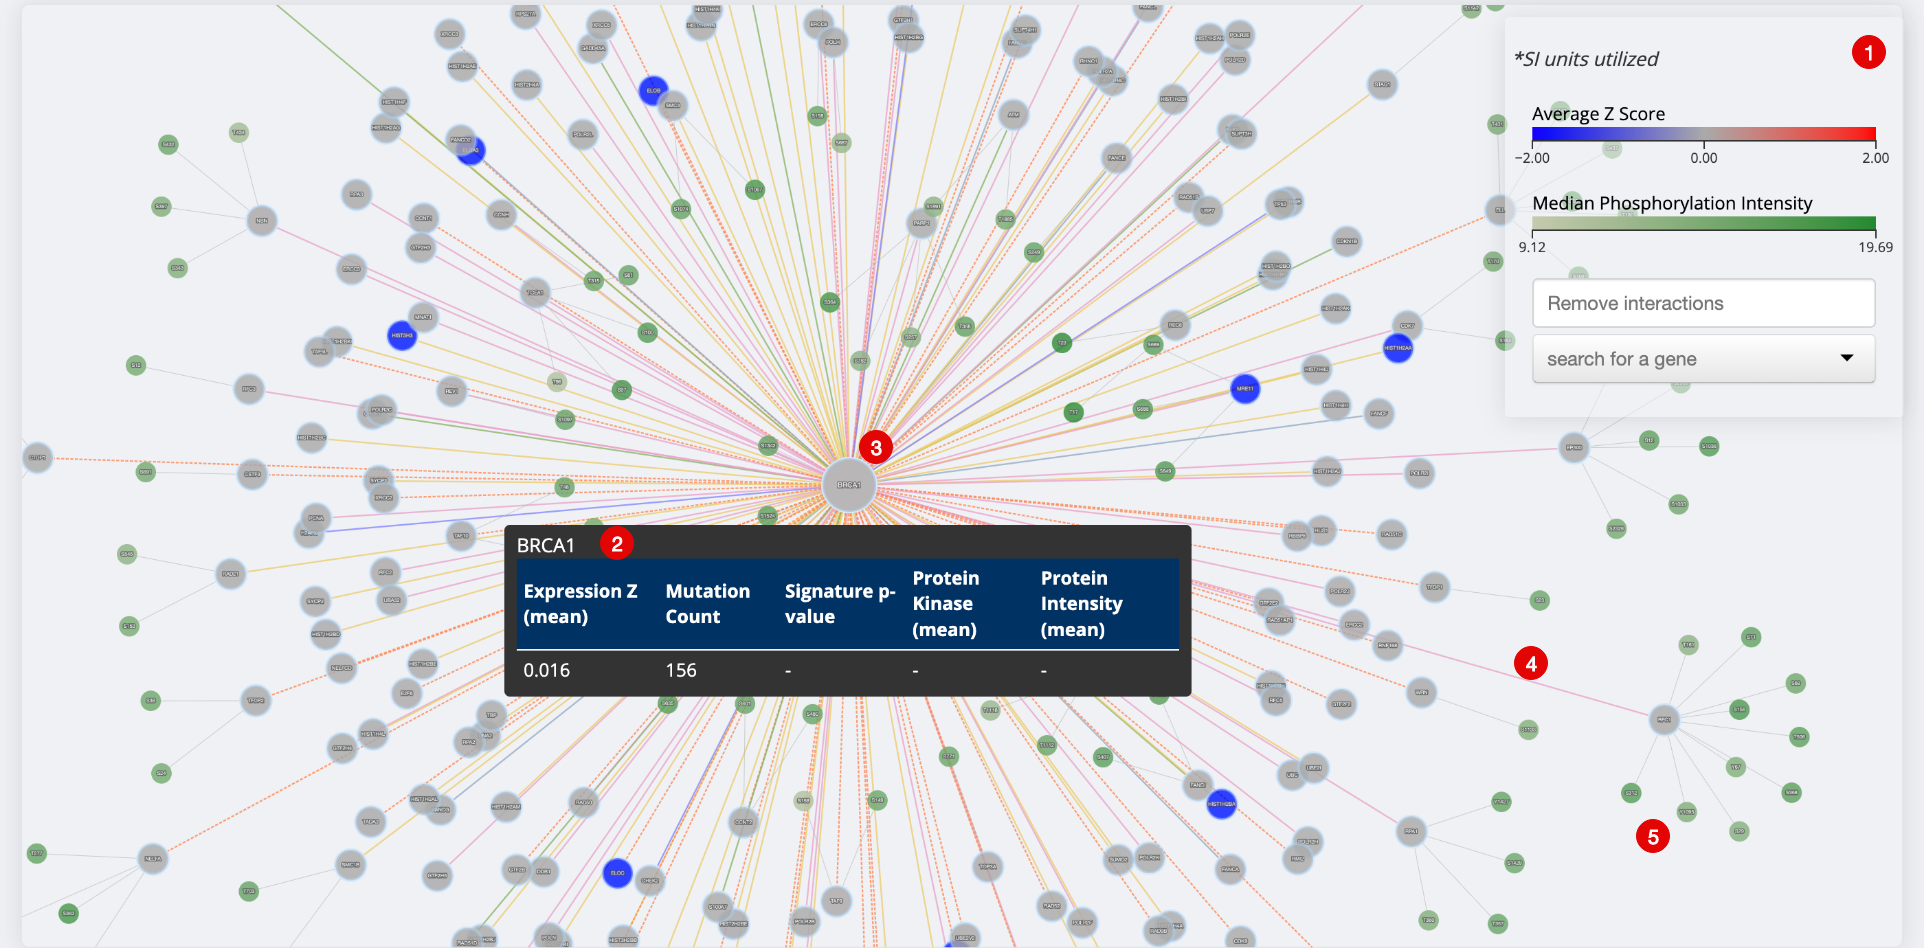
Network for BRCA1 in the Champions PDX dataset with all cancer types and models visualized, colored by average gene expression.
- Legend. Showing average Z-score and Phosphorylation Intensity. You can also remove interactions and search for a gene.
- Tooltip. Gives available values for gene expression, mutation count, signature p-value, kinase activity and protein intensity. Right click and click ‘Details’ for more information on a gene.
- Gene of Interest Node. Central nodes are the genes which have been entered into the ‘Genes of Interest’ input.
- Interaction Edge Shows directionality of each interaction by hovering over the line. Each line is colored based on the interaction type. To view/remove interaction types click ‘Remove Interactions’ in the legend.
- Secondary Nodes. Shows phosphorylation events detected. Median Phosphorylation Intensity is shown in the legend. Hover over each node to get the median phosphorylation intensity for each event.
Available Data
Champions PDX
Champions Cell Lines
CPTAC
Mutation Count
Gene Signature
Your Data
Key Terms
Common Analysis with Gene Network
Confirm an Interaction/Identify a New Interaction for a Pathway of Interest
- Click the pathways icon after ‘Genes of interest’
- Find your pathway of interest and click ‘Select genes’
- Select your desired dataset.
- Select a specific cancer type, if desired. A specific cancer type is required for all datasets other than Champions PDX.
- Select data for coloring genes from Node Coloring dropdown menu.
- Click ‘View’
View/Confirm Phosphorylation Activity in Primary Samples in Public Dataset (CPTAC)
- Input your genes or proteins of interest in the ‘Genes of interest’ text bar.
- Select ‘CPTAC’ dataset.
- Select a specific cancer type if desired.
- Select data for coloring genes from Node Coloring dropdown menu.
- Click ‘View’
References and Acknowledgements
Gene Network is based on the Pathway Commons Database. Pathwaycommons.org. 2022. Pathway Commons: A Resource for Biological Pathway Analysis. [online] Available at: https://www.pathwaycommons.org/

